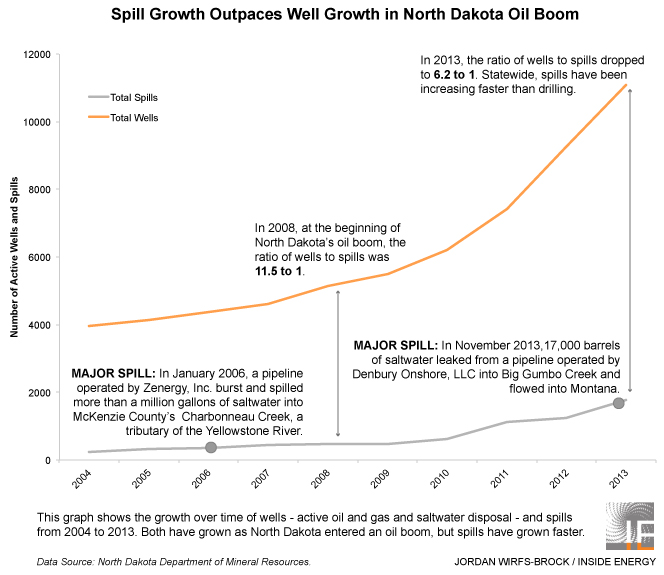
As oil booms in North Dakota, the rate of spills has been growing, Emily Guerin reported. An Inside Energy analysis of data provided by the state has found that the spill rate — the number of oil and saltwater spills per well — has nearly doubled since the beginning of the boom. Saltwater is a by-product of oil extraction, and can destroy farmland for years.
Finding detailed data on saltwater spills – more than 800 happened in North Dakota in the past year – was hard. Really hard.
The North Dakota Department of Mineral Resources provided summary statistics. And this was great – we were able to use it to look at the ratio of oil and saltwater spills to wells and how that changed over the course of North Dakota’s oil boom.
But when Inside Energy contacted the North Dakota Department of Health, which tracks oilfield spills in two separate databases, to request more detailed saltwater spills information, they would not export the information from their database. They told us to copy and paste data from their website into a spreadsheet.
So we did just that. And we made our own saltwater spills database.
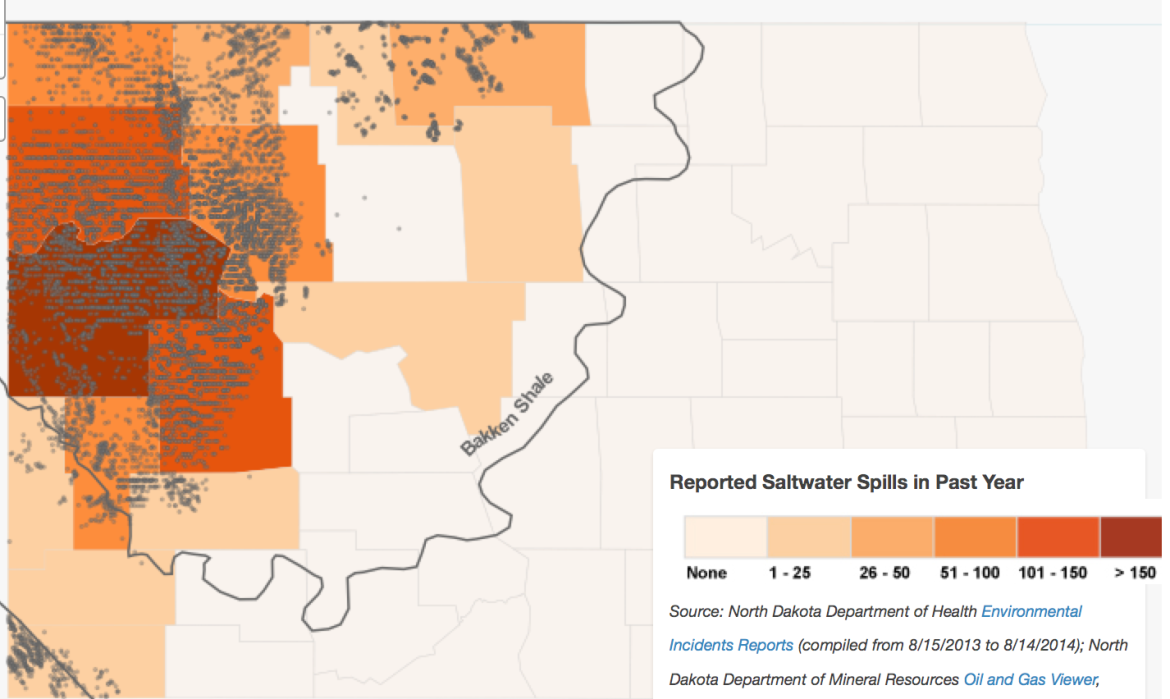
A database that let us do things like map the frequency of spills by county.
And calculate the containment rate for saltwater spills. (It’s pretty good, by the way – 84%.)
And figure out that, on average, 5 gallons of saltwater are spilled every minute.
(Lest you think we are complaining, at least North Dakota’s information is available online. When we called Wyoming, we learned the only way to find out how many saltwater spills occurred in the past year is to drive to Casper and look up the paper reports ourselves. Colorado provided us summary saltwater spill information as a PDF.)
Map: A Year of Saltwater Spills in North Dakota
This map shows the number of saltwater spills reported in North Dakota, by county, in the past year. Darker colors correspond to more spills. The grey dots are active oil and gas wells. Mouse over a county to see how many saltwater spills it had, how many barrels of saltwater were released, and how many active oil and gas wells are in that county.
How did we do create our spills database?
(Warning: Wonky data stuff ahead!) To get detailed information on the size, location, type and date of spills, we had to extract data from two separate state databases hosted on the North Dakota Department of Health’s website:
- The general environmental incidents database, which includes everything from diesel fuel spilled at gas stations to fracking fluids.
- The oilfield incidents database, which is mostly oil and saltwater spills and is broken into two sub-databases:
- one for contained spills (contained = did not make it off the well pad and contaminate ground or surface water)
- one for uncontained spills.
To complicate things further, the web-database only includes spills reported in the past 12 months. Older spills are in yet a different database. (Just another fun data hoop to jump through.)
We copied all of the records – one page at a time – from the various databases that were reported the past year (we chose a one-year period from August 15, 2013 to August 14, 2013).
The raw data included all kinds of spills – oil, gasoline, even molasses – so we had to filter out just the saltwater ones. In the oilfield incidents database, that was pretty easy: There’s a field for the volume of saltwater released. If a spill had a non-zero value for saltwater volume, we kept it. But for the environmental incidents database, that meant searching for keywords like brine, salt, saltwater (sometimes spelled salt water), and produced water. The descriptions of what was spilled aren’t consistent, so there’s no way to be sure we got all the saltwater spills.
One final wrinkle: Some of the spill volumes – how much liquid leaked – were reported in barrels, some in gallons. So we converted them all to barrels. (If you were curious, there are 42 gallons in a standard barrel.)
And here’s the result: A Year of Saltwater Spills in North Dakota. Take a look around – it’s on Google Drive so you can download it and do your own analysis with it.