Oil and gas workplace safety is a national issue: An oil and gas worker is six times more likely to die on the job than the average American. But the real story takes place locally.
The oil and gas industry – its political and economic backdrop, its boom-time nature, its safety culture – isn’t the same everywhere. And as Emily Guerin and Stephanie Joyce are reporting during Inside Energy’s Dark Side Of The Boom series, those differences can cost lives.
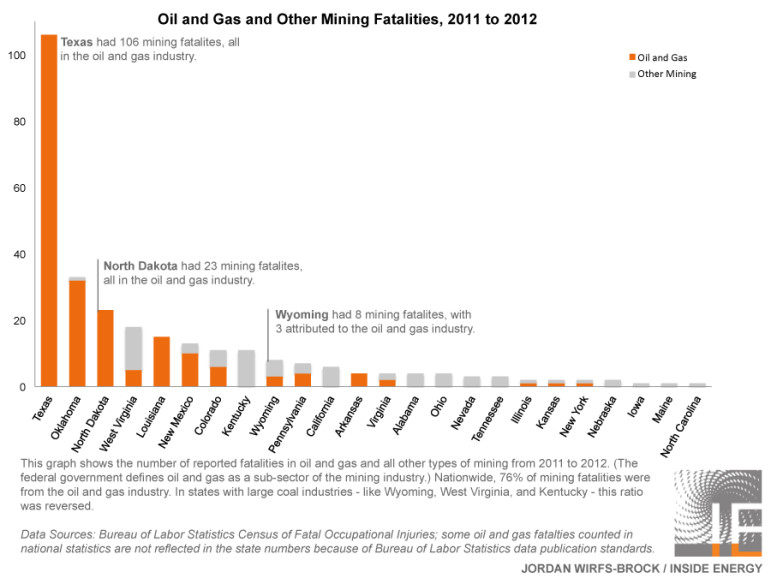
Here’s a look at the fatalities in the oil and gas industry, and mining as a whole, in energy boom states in 2011 and 2012, based on data from the Bureau of Labor Statistics:
Some important things to notice:
- Texas had 106 fatalities, the most of any state, and all of those mining fatalities were in the oil and gas industry.
- Oklahoma had the second most mining fatalities, with 32. All but one of those were in the oil and gas industry.
- North Dakota was third, with 23 mining fatalities, again all in oil and gas.
- Colorado had 11 mining fatalities, and 6 of those were in oil and gas.
- Wyoming had 8 fatalities, and 3 of those were in oil and gas.
Nationwide, three-quarters of all mining fatalities were in the oil and gas industry. But in states with active coal industries – like Wyoming, West Virginia, and Kentucky – the opposite is true.
Just because Texas had the most fatalities doesn’t mean it is the most dangerous. Texas has a huge – and mature – oil and gas industry, the largest in the country in terms of workers, drilling rigs, and amount of oil and gas produced. To determine which state’s oil and gas industries are the safest and which are the most dangerous, we have to scale for the size of the local industry; we need to calculate a fatality rate.
We did that by using two indicators of industry size: number of oil and gas workers and numbers of active drilling rigs. These rates – deaths per 100,000 workers and deaths per 100 active rotary drilling rigs – allow us to make relative comparisons of the oil and gas industry’s safety record state by state.
Here’s a graph of the fatality rates in 2011 and 2012, using worker counts from the U.S. Census Bureau’s County Business Patterns and active rotary rig counts from Baker Hughes:
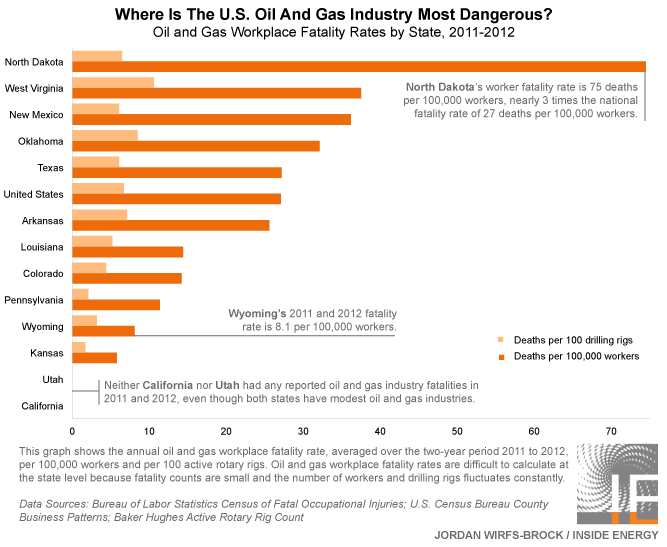
For fatality rate per 100 drilling rigs, there is little variation between states. But for fatality rate per 100,000 oil and gas workers, North Dakota stands out as an outlier: Its fatality rate, 75 deaths per 100,000 workers, is three times the national average of 27 deaths per 100,000 workers.
Here are some other interesting things to notice about fatalities per 100,000 workers:
- In addition to North Dakota, Oklahoma and New Mexico also have fatality rates that are higher than the national average.
- Texas’s fatality rate is approximately the same as the national rate.
- Louisiana’s fatality rate is lower than the national average.
Looking at oil and gas fatality rates is tricky, especially at the state level, because fatality counts are small and worker and rig counts fluctuate constantly. This method of calculating a per-worker fatality rate allows us to make some strong statements about states where the fatality count is high (like North Dakota and Texas). But we can’t make strong statements about states where the fatality count is low (like Wyoming and Colorado). But, these rates are one of the only ways we have of looking at how the safety of the oil and gas industry varies region to region.
Data Notes
- Read about why analyzing workplace fatality data is so tricky in this post designed for data-nerds and non-nerds alike.
- Read our entire methodology, as well as access raw data files and code, on GitHub.
- For a national look at America’s most dangerous jobs, check out this overview from CNN.
- Inside Energy looked at two years together (2011 and 2012) because fatality counts can fluctuate greatly year to year. When using small numerators to calculate rates, small changes in the numerator can cause large variations in the rate. Averaging two years together ensures a more accurate fatality rate.
- View a table of fatality rates here. We only published fatality rates for states that had sizable oil and gas industries. For states that had fewer than 5,000 average oil and gas workers and 20 average rigs in 2011 and 2012, we did not publish fatality rates. Fatality rates with a two-year fatality count that is less than 10, which are less useful for drawing conclusions and making comparisons, are indicated in grey.
- The 2013 (preliminary) state-level data for workplace fatalities from the Bureau of Labor Statistics will be available on September 25.