Between 2000 and 2014, the number of reported power outages – including weather-related outages – rose across the entire country. Why? An aging infrastructure, combined with a growing population and more frequent extreme weather, are straining the electric grid.
The grid disruption database shows a marked increase in outages from 2000 through the first half of 2014. Outages fluctuate from month to month, season to season, and year to year, but the trend-line shows a steady rise. Here are some other interesting observations:
- The five-year annual average of outages doubled every five years, which means the current five-year annual average is four times what it was fifteen years ago:
- For 2000 to 2004, there were an average of 44 reported grid outages per year.
- From 2005 to 2009, there were an average of 100 reported grid outages per year.
- From 2010 to 2013 (a four year period), there were an average of 200 reported grid outages per year.
- In the first six months of 2014, there were 130 reported grid outages – which puts that six month period as having more outages than all but four years since 2000.
- Comparing 2000 to 2013, the monthly average grid outages increased six-fold: In 2000, there were an average of 2.5 grid disruption events a month. In 2013, there were an average of 14.5 disruption events a month. In the first half of 2014, there were 21.7 events a month. In 2011, the year with the most reported outages, there were an average 25.6 reported events each month.
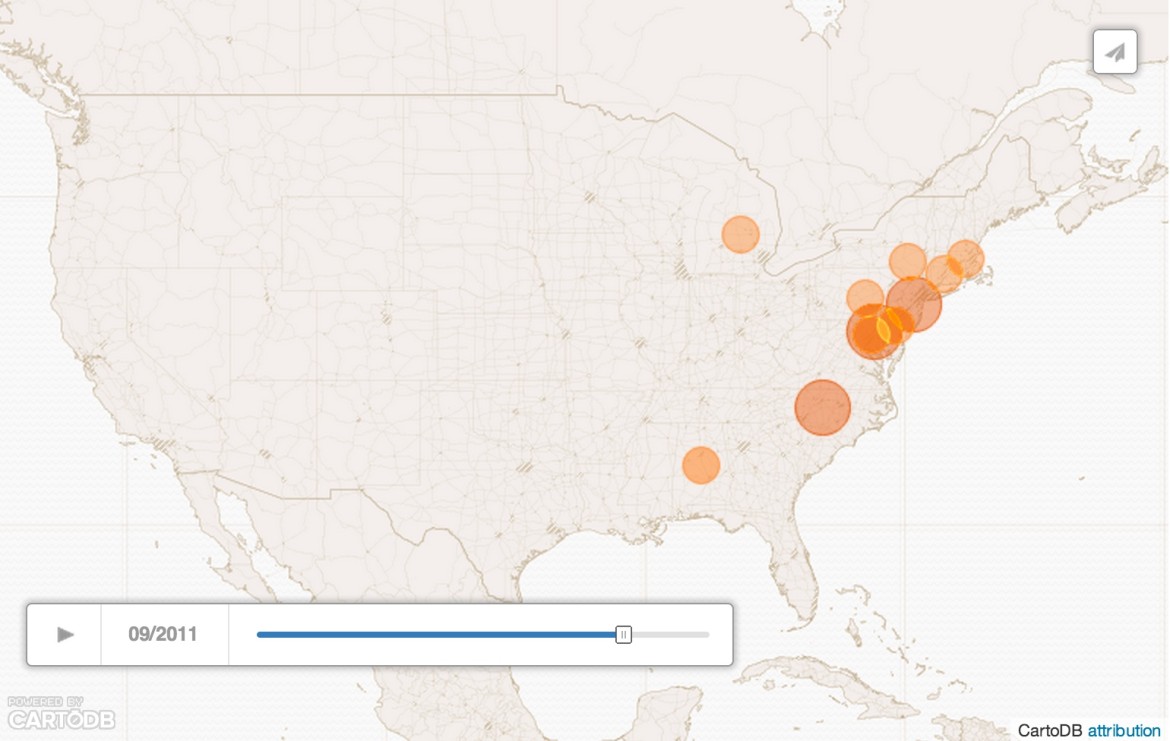
You can see the acceleration on the animated map below, which shows the location and size of 866 electric grid disruption events caused by severe weather over the past 15 years, sped up into one minute.
Tips for understanding the map:
- The slider at the bottom shows the month and year. You can pause it or skip forward/backward.
- Locations are shown as the center of the state where the outage occurred – even though the outage could have covered only part of a state, or several states.
- Larger, darker points represents power outages that affected more people – up to 4.6 million lost power in the largest reported grid disruption event.
Some interesting things to notice:
- June is the most common month for severe weather outages, followed by August and July.
- Since 2000, there have been 19 weather-related grid disruption events that affected more than one million customers: Eight were hurricanes and three were winter storms.
- Southern Company, which operates utilities in Georgia, Alabama and Mississippi, and American Electric Power, which operates utilities in Texas, Ohio, Kentucky and Indiana, experienced the most weather-related grid disruptions.
This data came from the Inside Energy grid disruption database, which we compiled and standardized from annual data available at from the Department of Energy.