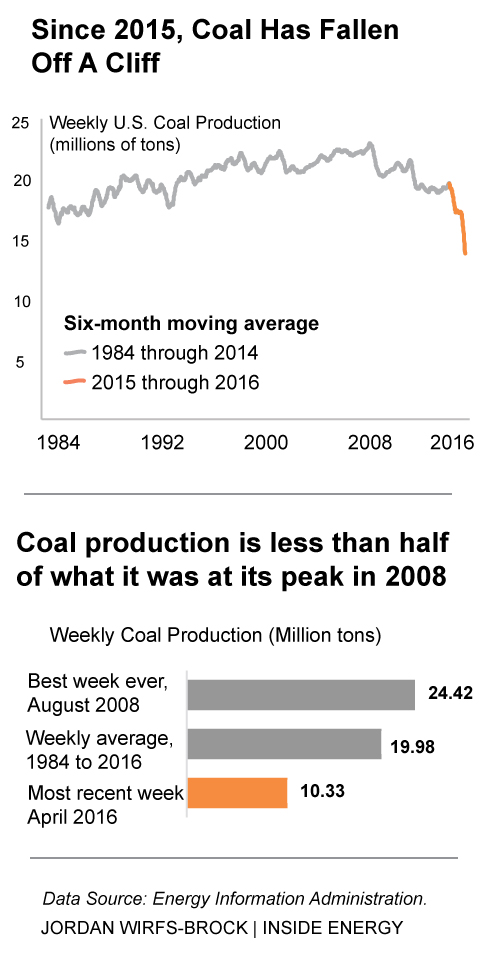
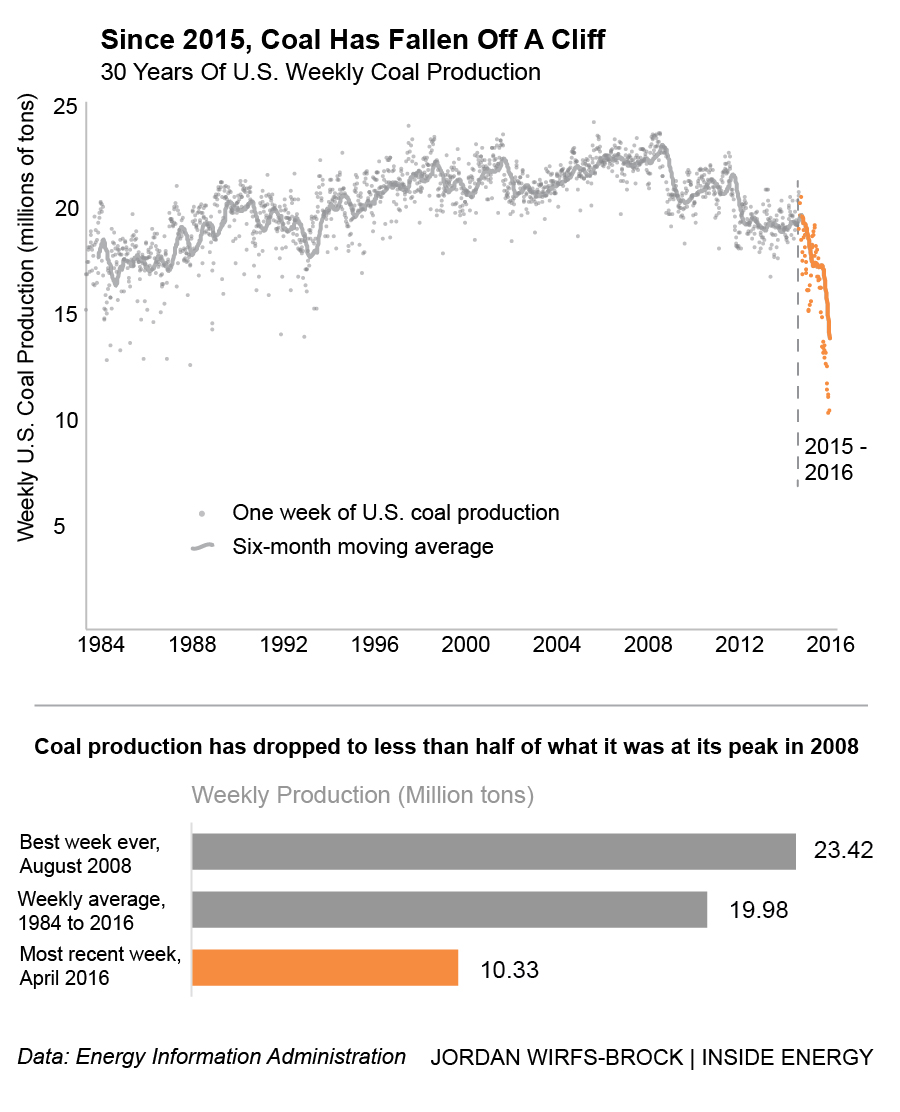
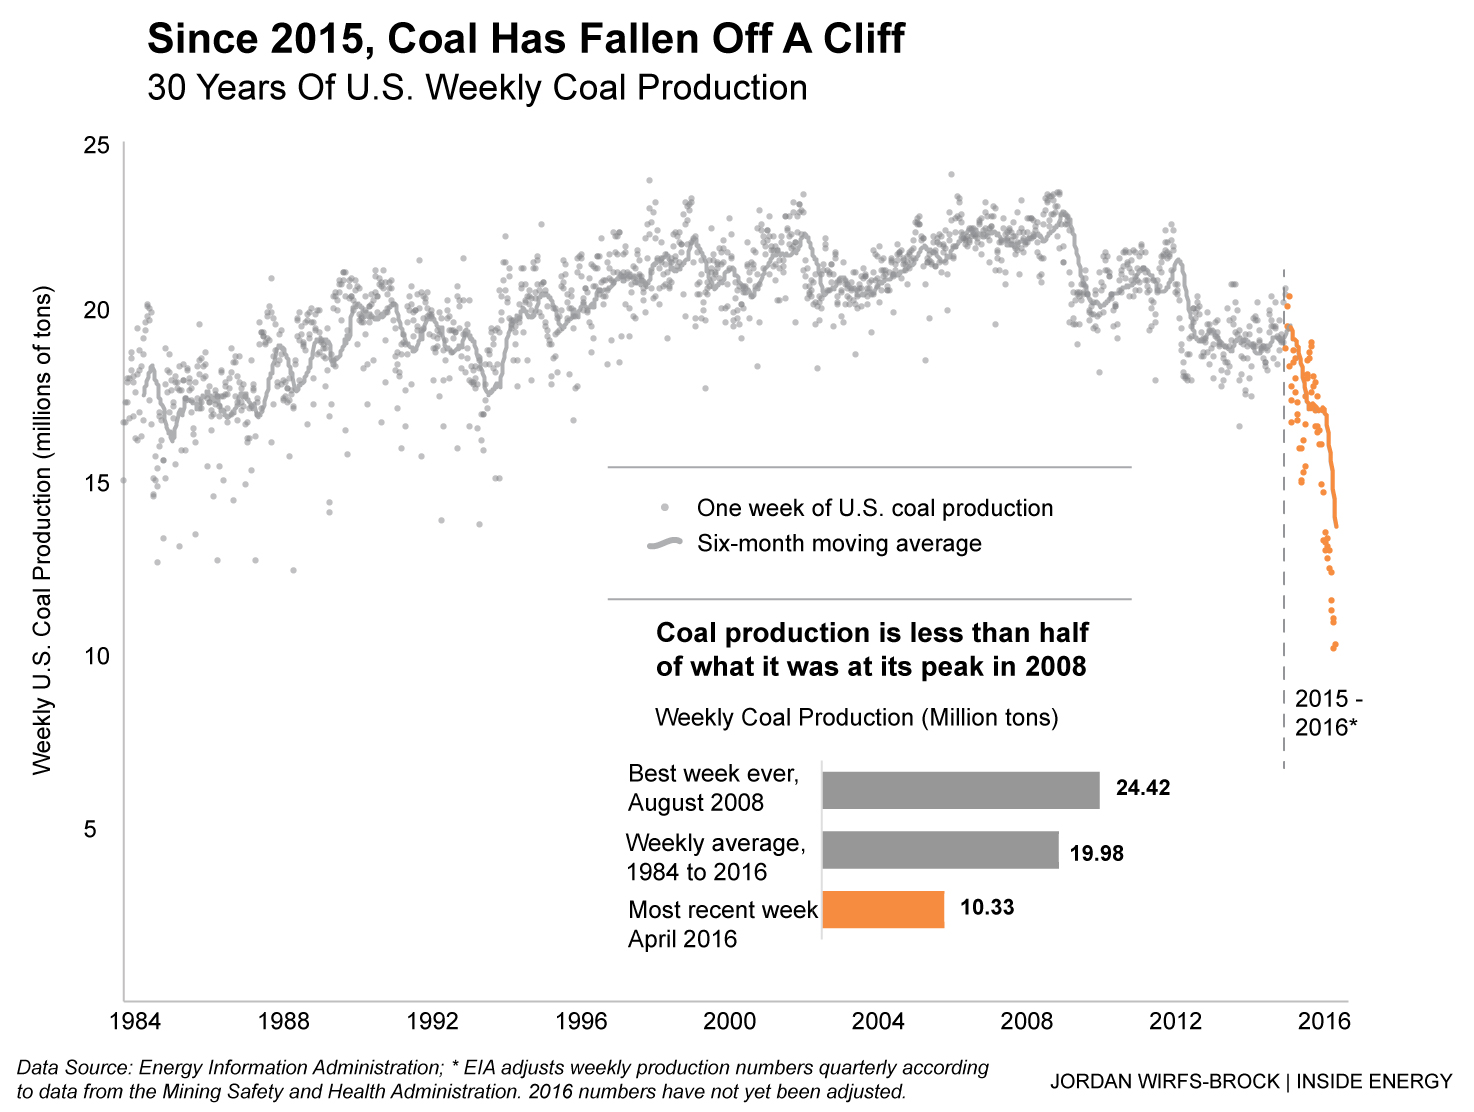
America’s coal industry is hurting: In the past year, thousands of workers have been laid off and a majority of the country’s major coal companies have filed for bankruptcy. Coal production is at 30-year low. Here’s what three decades worth of U.S. coal production looks like:
Get the data: CSV | XLS | Google Sheets | Source and notes: Github
The drop off in the past year (the orange portion of the graph) is staggering. But what does it sound like? Listen to this audio clip to hear coal production fall off a cliff:
So what happened to coal? In the 1980s, coming off the 1970s energy crisis and the newly updated Clean Air Act, production fluctuated. But it hovered at an average of 17 million tons a week from 1984 to 1988.
Then, starting in the late 1980s, cheap, low-sulfur Wyoming coal burst on to the scene. Wyoming coal was desirable because it helped coal-fired power plants meet air quality requirements without installing expensive scrubbers. During the 1990s, production soared, rising 13 percent, from 19.2 million tons a week in 1992 to 21.6 million tons a week in 1998.
And it kept on soaring. In the 2000s, America experiencing a housing boom. Construction of millions of new homes required lots of electricity. Natural gas prices were high, making burning coal the most economic way to feed the housing boom’s hunger for electricity. In 2008, coal reached a peak – averaging 23 million tons a week.
But then, everything changed. The U.S. natural gas industry took off, with the expansion of hydraulic fracturing techniques, and natural gas was cheap and abundant. Dozens of old coal-fired power plants have been retired and replaced with natural gas and renewables.
Coal has been up and down since 2010, with more downs than ups. And in the past year, it fell off a virtual cliff. Weekly U.S. coal production plunged from 20 million tons a week at the beginning of 2015 to just 10 million tons in the week of April 23, 2016. If we take out holiday weeks (like the Fourth of July and New Year’s), the six worst weeks for coal – ever – have been in 2016.
For coal, it’s back to the 1980s. What took three decades to build up has taken a year to undo. Which means communities whose economies rely on coal, like Wyoming, are figuring out struggling to figure out what comes next. For more on this topic, check out Leigh Paterson’s look at life after layoffs in Gillette, Wyoming, and ideas for how to diversify Wyoming’s economy, gathered at a recent Inside Energy event in Laramie.
How did we turn coal data into sound?
You are able to listen to coal production data through a process called sonification, where we map numeric data to musical tones. Here’s how we did it:
- Inside Energy downloaded weekly coal production data from the Energy Information Administration from 1984 through 2016.
- We removed short weeks (the Fourth of July and the weeks at the very beginning and end of the year), which represented blips in the data.
- Using a software package called MIDITime developed by Mike Corey of Reveal, we turned each weekly data point into a tone ranging over five octaves, with the pitch scaled to the highest and lowest data points.
- The weeks are then played at a rate of roughly nine weeks each second to get 32 years of coal data in just over three minutes.
Here’s the full sonification, without narration: