
Wikimedia Commons
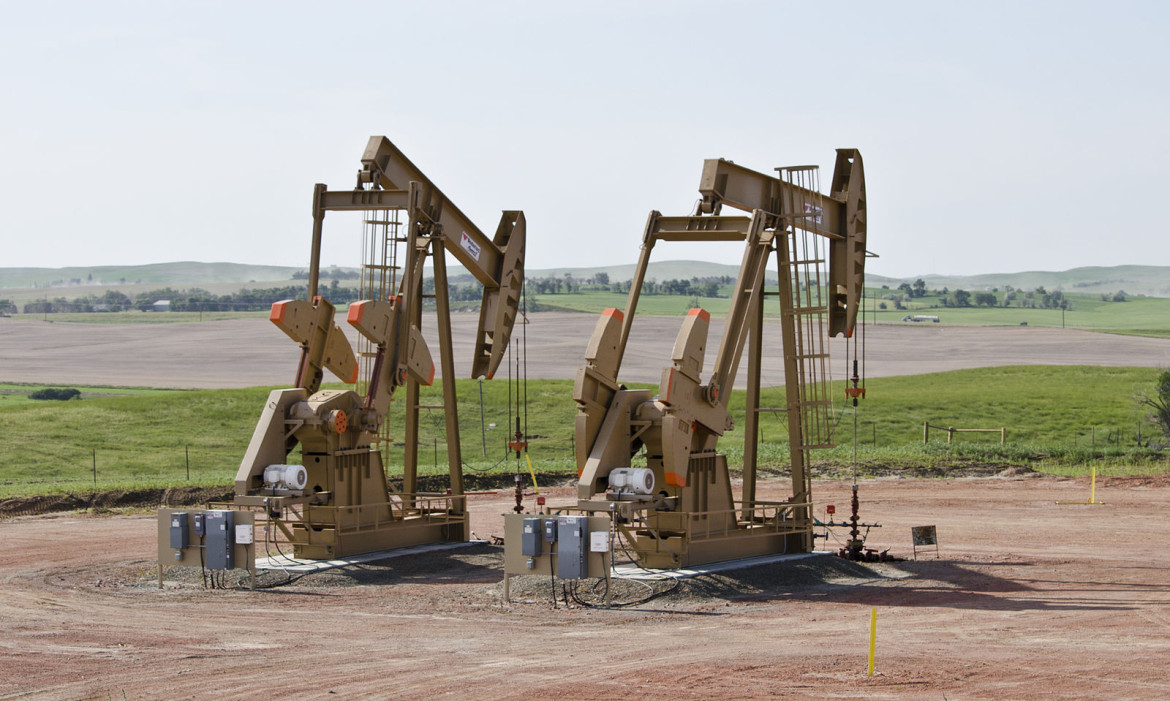
Pictured is a set of oil wells in McKenzie County, North Dakota. Oil is credited with being a driving force behind the state’s economic growth.
It’s not just the oil that’s booming in North Dakota. According to a new report by the U.S. Department of Commerce, in 2013 the state’s economy as a whole experienced the highest growth rate of any state last year.
Gross domestic product (GDP) in North Dakota has grown for the fourth consecutive year, posting a 34 percent jump from GDP in 2010.
Nice, but what’s GDP?
GDP represents the total market value of goods and services produced in country, or in this case, a state. It is a measurement of a region’s overall economic strength, taking into account exports, government spending and public and private consumption.
Last year, North Dakota’s GDP grew by 9.7 percent. (Compare that to the national GDP growth rate, which hovers at about 2 percent.) The state’s economy produced $50 billion in 2013, up from $35 billion in 2010. On top of that, the Department of Housing and Urban Development recently reported that North Dakota had the fastest growing housing sector in the U.S.
Unemployment in the state is the lowest in the country. It’s not even 3 percent.
What’s helping to thrust North Dakota into this coveted seat of economic royalty? Oil.
North Dakota is the number two oil-producing state in the nation, second to Texas. It produces about a million barrels of oil per day from shale drilling, mainly in the Bakken rock formation.
When it comes to GDP, Wyoming’s economy is the nation’s second strongest with a growth rate of 7.6 percent. Colorado ranked 8th nationwide, with a growth rate of 3.8 percent in 2013.
Here’s an illustration of GDP growth per capita. That is, the total rate of growth per person.
Compared to powerhouse states like New York or California, North Dakota and Wyoming have relatively small economies. Together they contribute about half a percent to the country’s overall GDP. But if you look at GDP per person in those states, the economic gains are striking. Based on population estimates from the U.S. Census Bureau, in 2013:
- North Dakota’s economy produced $68,804 per person, and grew 34% from 2010
- Wyoming’s economy produced $67,858 per person, and grew 2% from 2010
- Colorado’s economy produced $51,956 per person, and grew 4% from 2010
- The U.S. as a whole produced $49,115 per person, and grew 4% from 2010
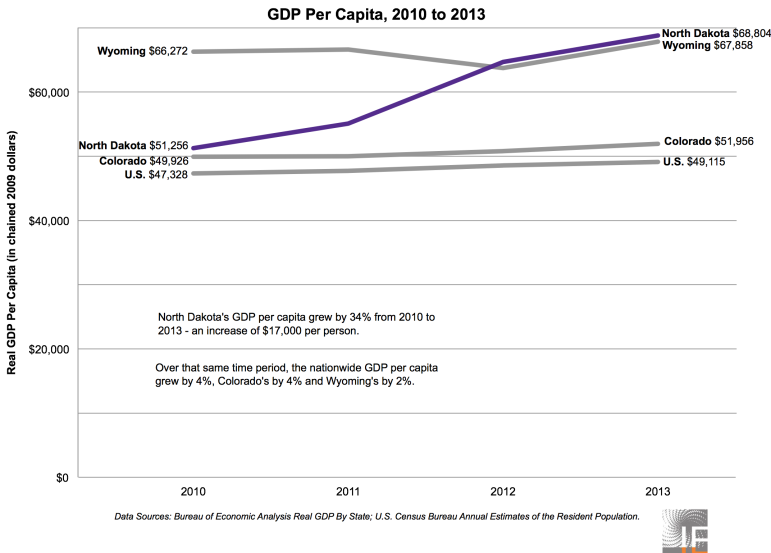
Not only has North Dakota’s economy been booming, its boom has outpaced population growth. In 2013, the state produced $17,000 more per person than it did in 2010.
Data Notes:
- We used “real GDP,” which adjusts GDP for regional economic differences such as cost-of-living. The Bureau of Economic Affairs reports real GDP by state in chained 2009 dollars.
- For population, we used the 2010 to 2013 population estimates released by the U.S. Census Bureau. These estimates use the 2010 population as a baseline. For comparison purposes, we also looked at the 2011 and 2012 estimates to the American Community Survey population estimates, and found that the numbers were consistent.
Jordan Wirfs-Brock also contributed to this report.