We’ve been tracking the rise of crude oil moving on railroads over the past few weeks, and we’ve learned a great deal.
Some things we know:
- A lot more crude oil is traveling by rails now than it was a few years ago, the equivalent of one railroad tank car every 77 seconds.
- Several recent crude-by-rail accidents have been deadly and devastating.
- Crude-by-rail accidents are on the rise, but the rate of accidents isn’t necessarily increasing.
- Railroad companies are now required to tell local authorities when they’ll be moving Bakken oil through their communities, but are fighting this requirement.
Some things we still don’t know:
- What exact route does each shipment of crude oil takes?
- When and how often does oil move through cities and towns? (This information is starting to trickle out: As railroads are being forced to give this information to state authorities, some states are beginning to release it to the public. The Associated Press reported this week that dozens of trains pass weekly through populated corridors in the Midwest and 19 per week travel to Washington state.)
- Is Bakken oil the only oil we need to worry about in terms of safety?
One way of uncovering the specifics about where and how oil is moving along railroads is with waybills.
What is a waybill?
A waybill is a receipt created by the railroad companies of every carload of freight that travels on rails. This accounting tool has information about what type of commodities are on each car, where the cars came from, and where they’re going.
Waybills are so essential to the function of railroads that model train enthusiasts create their own waybill systems designed to work just like the real ones.
Here’s what a waybill looked like in 1843:
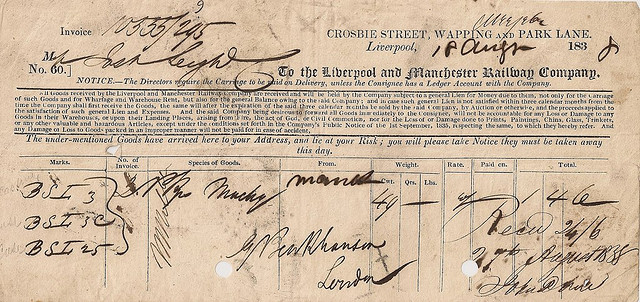
Liverpool and Manchester Railway Waybill, 1843. Shared via a Creative Commons Attribution -NonCommercial License from Flickr user Ian Dinmore.
Modern waybills are usually electronic. You can see what BNSF – by far the largest crude-by-rail company – waybills look like in their electronic shipping guide.
In addition to origin, destination and commodity information, waybills also carry dozens of details about each shipment, things like:
- freight revenue
- type of train car
- wheel bearings and brakes on the car
- other modes of transportation (truck, ship, etc.) the freight travels on
- freight weight
- whether the train is carrying hazardous material
Railroad companies submit waybills to the Surface Transportation Board, who releases a yearly public-use sample that represents roughly one percent of the millions of cars of freight that travel on U.S. railroads. The 2012 sample (2013 waybills will be released later this year) has:
- 623,096 waybills and 34,377,852 carloads of freight
- 2,106 waybills and 72,365 carloads of crude petroleum
Although public waybill data is only a small fraction of all railroad freight, it’s large enough to reveal trends and patterns. Here’s what we have learned from analyzing the 2012 sample:
Where is the oil coming from?
The majority – 85 percent, or 61,211 of 72,365 carloads in the sample – of crude oil traveling on rails originates from the regions around Minot and Bismarck, North Dakota, so is likely Bakken oil.
This map shows a year of crude-oil trains, based on where they originate, in 60 seconds. Larger dots represent more carloads of oil. The time slider at the bottom shows the month, and allows you to pause the animation. The Williston Basin, which includes the Bakken region, is outlined in white.
Here’s what the map tells us:
- The vast majority – 85% – crude-by-rail is Bakken crude, and it’s moving on huge trains. Not only is Bakken the source of most of the crude oil traveling on railroads, it’s also the source of most of the large trains that can be more than a hundred cars long.
- Most of the crude-by-rail originating outside of the Bakken region are small loads coming from Texas, Wyoming, Oklahoma, and Canada. A few crude oil trains originate in Minneapolis — most likely oil that arrives there via pipeline and is then loaded onto trains for the next leg of its journey.
- Crude-by-rail accelerates as the year progresses. If we look at total carloads of crude by month, we see a clear increase (until the cold winter months of November and December slow the pace). This makes sense, considering we know crude-by-rail increased about 75 percent from 2012 to 2013, and the first quarter of 2014 is on record-setting pace.
Where is the oil going?
This map is similar to the one above, but each dot represents where a crude-by-rail train terminates — that is, where it leaves the rails. Again, this is all the crude oil trains from the 2012 waybill sample, shown in 60 seconds, and larger dots represent more carloads of oil. Here, you’ll see that most of the trains are going to Philadelphia, Seattle/Tacoma, and Texas.
There aren’t as many trains on the destination map as there are on the origin map. Why? Unfortunately, most of the crude oil waybills – and 75 percent of the trains from Minot and Bismarck – do not have a termination location, which means we don’t know where they go. This is because the STP removes some information on the waybills to protect the privacy of the railroad companies.
However, we do know how far it’s going.

And of the fifteen percent of crude oil where we do know a termination point:
- 45% is going to Philadelphia-Wilmington-Atlantic City, PA-NJ-DE-MD
- 27% is going to Seattle-Tacoma-Bremerton, WA
- 24% is going to Houston-Galveston-Brazoria, TX
- 6% is going to Lake Charles, LA
- 2% is going to Los Angeles-Riverside-Orange County, CA-AZ
- Less than 1% is going to Shreveport-Bossier City, LA-AR and Minot, ND
How much of Bakken oil travels on large trains (more than 35 carloads), where new safety regulations apply?
The waybill sample showed that almost all Bakken crude, 96 percent, travels on trains that have 35 cars or more, which means railroad companies would be required to tell state emergency management personnel about them. Only four percent travels in smaller trains where these regulations would not apply.
We actually know a lot about crude oil traveling on rails. But we still don’t know what’s happening in real-time. This data is from 2012, when the crude-by-rail boom was just getting started. Things have changed rapidly in the past few years.
As railroad companies begin to release information to states, we’ll be able to know where and when crude oil is moving near cities and towns as it happens, instead of years after the fact.
Data Notes:
- The public use waybill sample and its associated data notes are available to download from the STP. We reformatted the data as an Excel file and added labels for the attributes. You can download our version of the 2012 file here.
- Each origination and termination location is given as a BEA region, not an exact location. On the maps, the origination and termination points are shown as the main city in each region (for example: Bismarck, North Dakota).
- In this analysis, we focused on crude petroleum waybills, which are STCC code 13111.
- Tools used in this analysis: Excel, Open Office Base, Google Fusion Tables, CartoDB, Inkscape. A huge thanks to Simon Rogers, whose tutorial on making animated maps with CartoDB’s Torque is how we were able to create the visualizations.

