Hang out with people who think a lot about electricity and renewable energy for an afternoon, and sooner or later you’ll hear them talk about a duck. The conversation will inevitably turn sinister: They’ll talk about flattening the duck, or even cutting its head off.
No, they’re not sharing taxidermy tips or favorite confit recipes: They are talking about the future of our energy infrastructure, and how everything you know about electricity and utilities could be changing fundamentally and forever.
What is the duck?
We don’t use energy – and in particular, electricity – at a constant rate. Over the course of a day, we use more power during peak hours. And over the course of a year, we use more electricity in the winter, when days are shorter and the weather is colder, and in the summer, when people run air conditioners to stave off the heat.
Utilities and grid operators call what’s coming out of the grid, based on what we know about how people use electricity, the forecasted load. The amount of electricity coming into the grid from solar panels and wind turbines is the variable production (variable because the wind doesn’t always blow and the sun doesn’t always shine). The difference between the two at any given time is called the net load. It’s essentially the amount of electricity the grid has to supply from reliable power sources like natural gas or coal-fired power plants. It’s the wiggle room the grid has to meet so it doesn’t fail.
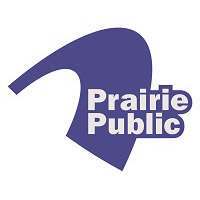
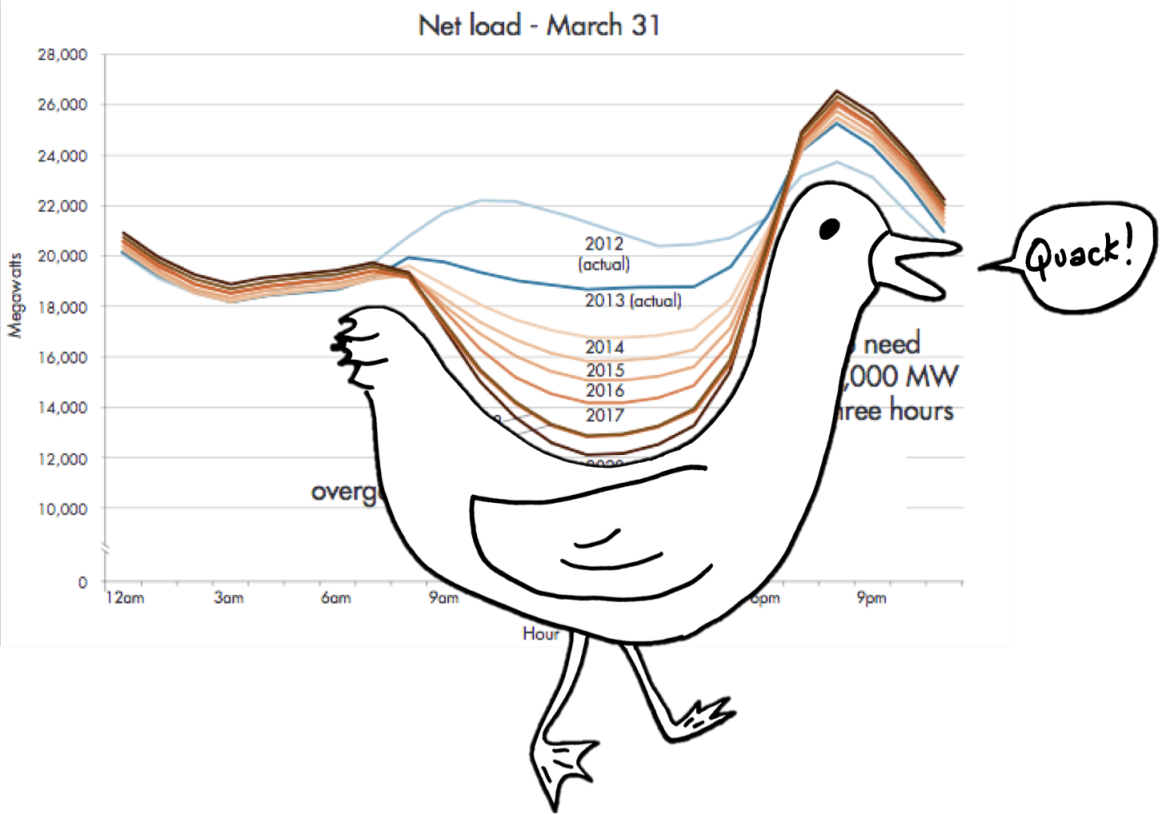
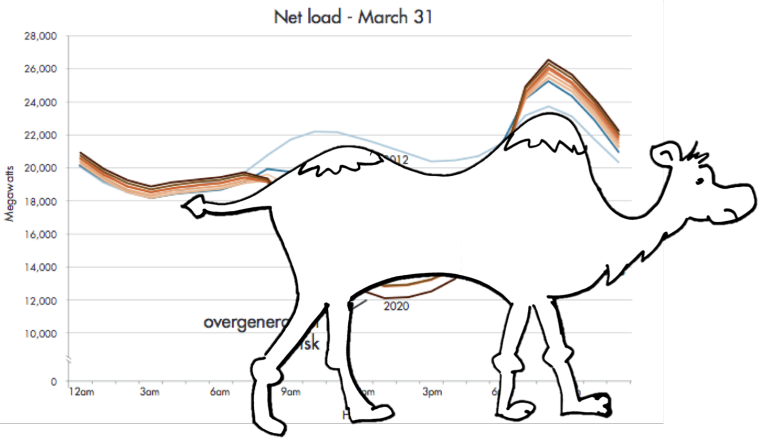
California ISO, which operates a large part of California’s electric grid and is focused on future grid security, published a (now infamous among renewable energy nerds) graph of what the net load looks like today, and what it could look like in the future as California switches to a mandated renewable- and solar-reliant electricity system.
The blue lines at the top are what the net load looked like in 2012 and 2013, based on real data from the grid. The brown lines are future projections of what the grid load might look like, culminating with 2020.
Net load curves for March 31, from 2012 to 2020, based on analysis by California ISO. Source: California ISO.
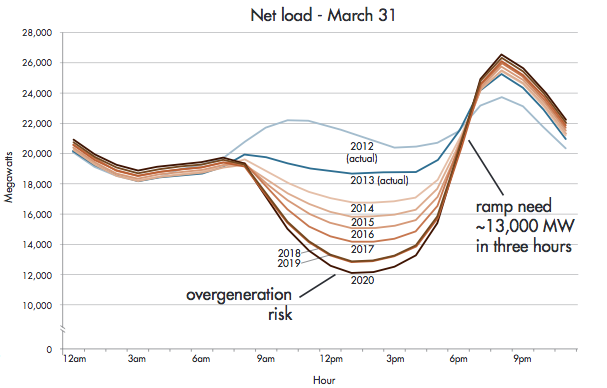
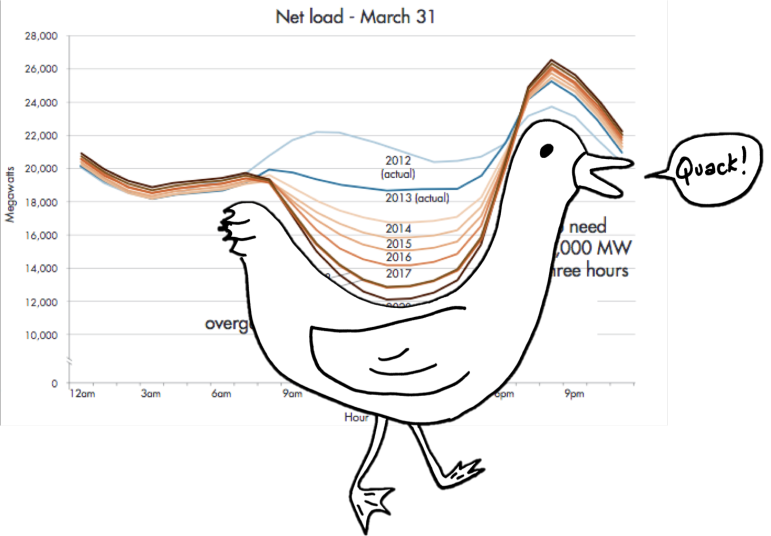
See the duck? What about now:
California ISO / Jordan Wirfs-Brock
In 2020, when 33% of California’s electricity is supposed to come from renewable sources, the net load curve will look like a duck.
There’s a peak in the morning as people wake up and start to use electricity, and before there’s a lot of sunlight. This is the duck’s tail. Then, as the sun comes up, solar power generation picks up, dropping into the belly of the duck. In the evening, when the sun goes down and solar powers stop generating power, the curve ramps into the duck’s head.
There’s not actually a single duck – there are hundreds of ducks: a different duck for every day of the year. And the duck changes over time as more renewable power is added to the mix.
Right now, the net load curve looks more like a camel:
California ISO / Jordan Wirfs-Brock
Right now, California’s net load curve looks like a camel, with smooth slopes.
What happens when we move from a fossil fuel camel to a solar duck?
California ISO’s graph projecting future net loads shows that adding on more renewables will make a problematic duck. If the duck’s belly drops too low, that means renewable sources are producing too much electricity, more than we can use. So it gets wasted, or could damage the grid. And with a sagging duck belly, adding more renewables won’t do any good.
When the duck’s peaks are high – its head and tail – there isn’t enough electricity coming from renewable sources to meet the demand. So it has to come from elsewhere, like traditional power plants or imports from other utilities. Because power plants take a long time to turn on and to shut down, the longer and steeper the duck’s neck and tail, the harder it will be for utilities to provide power when the sun isn’t shining and the wind isn’t blowing.
But there’s another potential way to change this duck: energy storage.
Why do we need to flatten the duck?
With energy storage, we could save and store electricity produced by solar panels when the sun is shining. We could then use that electricity at night. Using storage would effectively flatten out the duck’s curves – or more morbidly, cut off its head and tail.
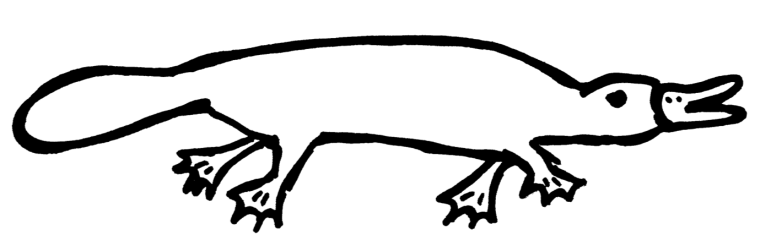
With a flat duck, we could in theory rely completely on variable renewable energy sources like solar and wind. What we really need is a duckbilled platypus instead of a duck:
Jordan Wirfs-Brock | Inside Energy
With grid storage, we can achieve a flat duck – or maybe a platypus.
But the current state of energy storage – in terms of technology, regulations, and infrastructure – is nowhere near where it needs to be. We’re not there yet, but engineers, policy makers, and grid specialists are working on it.
The duck is a problem, not a solution
The duck curve is problem statement, not a solution. Some utilities claim the projected duck’s curves are too steep, and will never be met with the current state of grid and energy storage technology. And with so many strategies for dealing with the duck, the biggest challenge may be honing in on which ones make the most economic and political sense. California isn’t the only state dealing with the duck: Other states, including Colorado, have renewable energy standards that they’ll be striving for in the coming decade that will require significant grid updates.
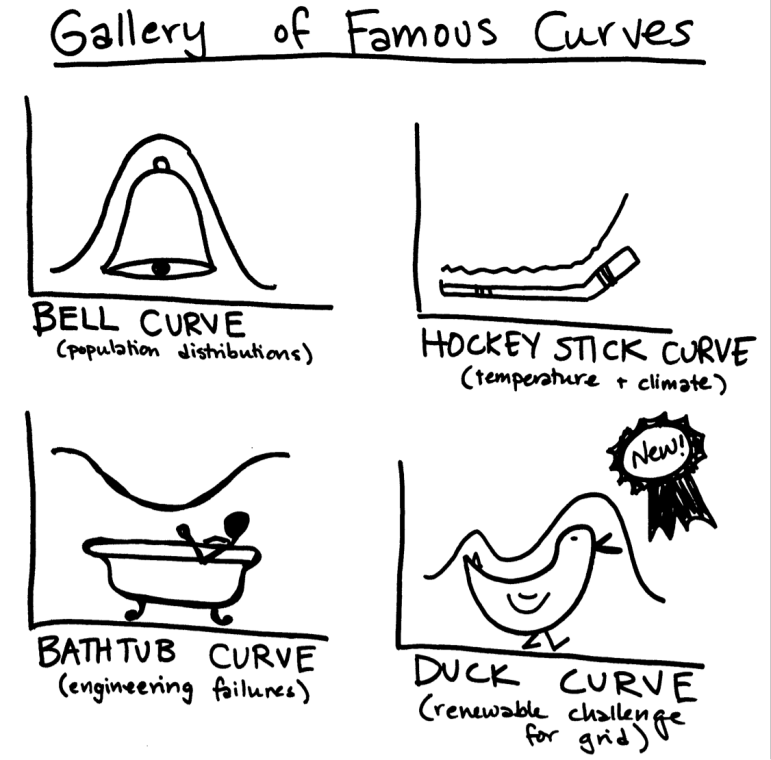
Whether or not we ultimately figure out how to flatten the duck, it joins good company – the bell, the hockey stick, the bathtub – in a cache of curves that represent more than just a mathematical relationship. They represent a framework for which we can think about, and discuss, complex problems and relationships in simple yet extendable terms. Which is an essential step toward solving them.
Jordan Wirfs-Brock | Inside Energy
Introducing the newest member of the gallery of famous curves: the duck curve.