Just when you thought you’d wrapped your head around energy reserves, the plot thickens.
Last time, we learned how it’s possible for “proved” U.S. natural gas reserves to be at an all time high, even as production has risen every year for more than a decade. Wouldn’t we expect reserves to be more depleted today if we’ve been using more and more of a resource each year over the last decade?
To review, proved reserves are an estimate of how much natural gas can be extracted in future years based on the current state of the oil and gas industry, the economy and technology. As oil and gas companies grow, and new natural gas deposits are discovered, proved reserves expand. As natural gas is extracted for production, proved reserves shrink. In recent years, the difference between expansion and extraction has been positive.
But when it comes to oil and gas, proved reserves are only part of the picture — and a small part, at that.
The vast majority of natural gas left in the ground is “unproved.” This means that we cannot readily access it because the infrastructure is not in place, or it doesn’t make financial sense, or the presence of natural gas is assumed but not confirmed.
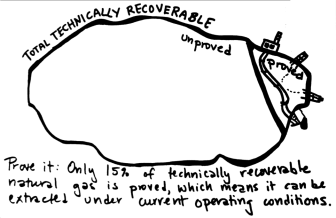
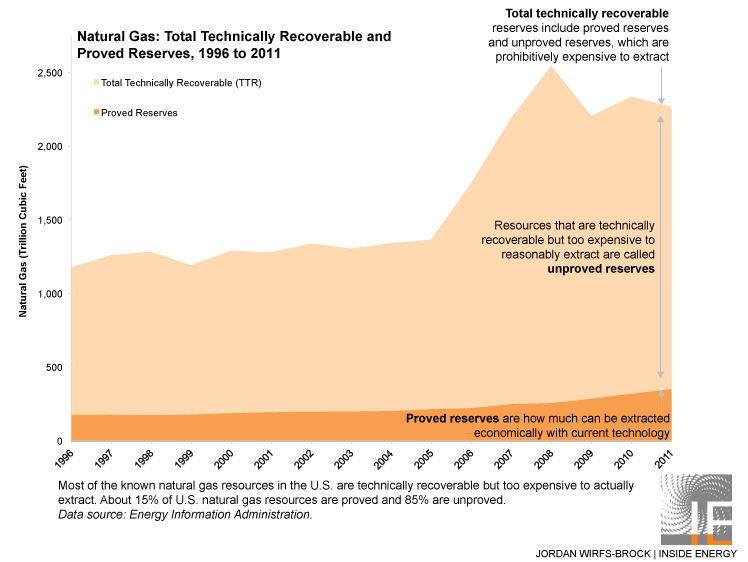
Only a small sliver — about 15 percent — of technically recoverable natural gas in the U.S. is proved. The rest, around 85 percent, is unproved.
Like proved reserves, unproved reserves change over time and have also spiked in the past decade. Here’s how proved, unproved, and technically recoverable natural gas resources have changed over time based on data from the Energy Information Administration:

Get the data: CSV | XLS | Google Sheets | Source and notes: Github
The EIA’s 2012 estimate for technically recoverable natural gas in the U.S., 2,266 trillion cubic feet, would last between 80 and 90 years at current production levels — if, of course, that estimate is accurate and if we develop the infrastructure to access it. Note that those ifs are not trivial.
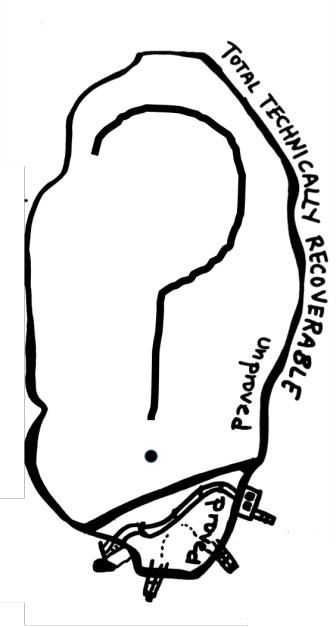
The further we look beyond what the wells can actually reach at this very instant, the murkier estimates get. Think of the line on the graph above showing technically recoverable resources as fuzzy, not solid: There’s way more natural gas in the ground than we can access right now. However, it’s more appropriate to look at unproved natural gas as a question mark rather than a stockpile.
Data Notes:
- Total technically recoverable resources for U.S. natural gas are from the Energy Information Administration’s Oil and Gas Supply Module, which is updated every year and published as a supplement to the Annual Energy Outlook.
- Inside Energy used archived EIA reports to compile data for technically recoverable resources. View our compiled data for technically recoverable natural gas and links to the corresponding sources.
- The EIA reports technically recoverable reserves for each year as of January 1; Proved reserves, however, are given as of December 31 (and can be downloaded from the EIA as an Excel spreadsheet here). To show both values on the same axis, we used the proved reserves year (thus the January 1, 2012 estimate for total technically recoverable natural gas is plotted as 2011).