At a Federal Energy Regulatory Commission meeting last week on the winter outlook for utilities, a fleeting comment about the “duck curve” garnered some attention.
Why?
The duck curve has become shorthand for the challenges that utilities face as they add more solar power and other renewables to the grid. It comes to us from California, which has nearly half of the country’s installed solar generating capacity.
When the sun goes down, that solar power has to be backed up by other power sources. A curve of how much conventional power – typically from gas-fired power plants – California needs throughout the day is high in the morning before sunrise, low all day long when the sun is shining, and high again at night after the sun sets.
It looks like, well, a duck:
CAISO and Jordan Wirfs-Brock
This line shows when California needs conventional (non-solar) power: high demand in the morning, low all day, and high again all night. It looks like a duck.
For more on the duck curve, check out Inside Energy’s illustrated explanation from October of 2014.
As California adds more solar, it grows more duck-like. That is, the daytime belly sags more. This leads to some technical challenges, like ramping up gas-fired power plants quickly, and making sure that too much solar power doesn’t overload the grid.
Why is FERC talking about it now?
The idea of the duck has been around for a long time: California’s utility, CAISO, first published its duck chart in 2013, and researchers at the National Renewable Energy Laboratory modeled similar demand curves back in 2008 (although they didn’t call it a duck). Now, we’re seeing those projections play out in the real world.
The FERC presentation included this chart, showing how the duck has deepened from January 2011 to January 2016:
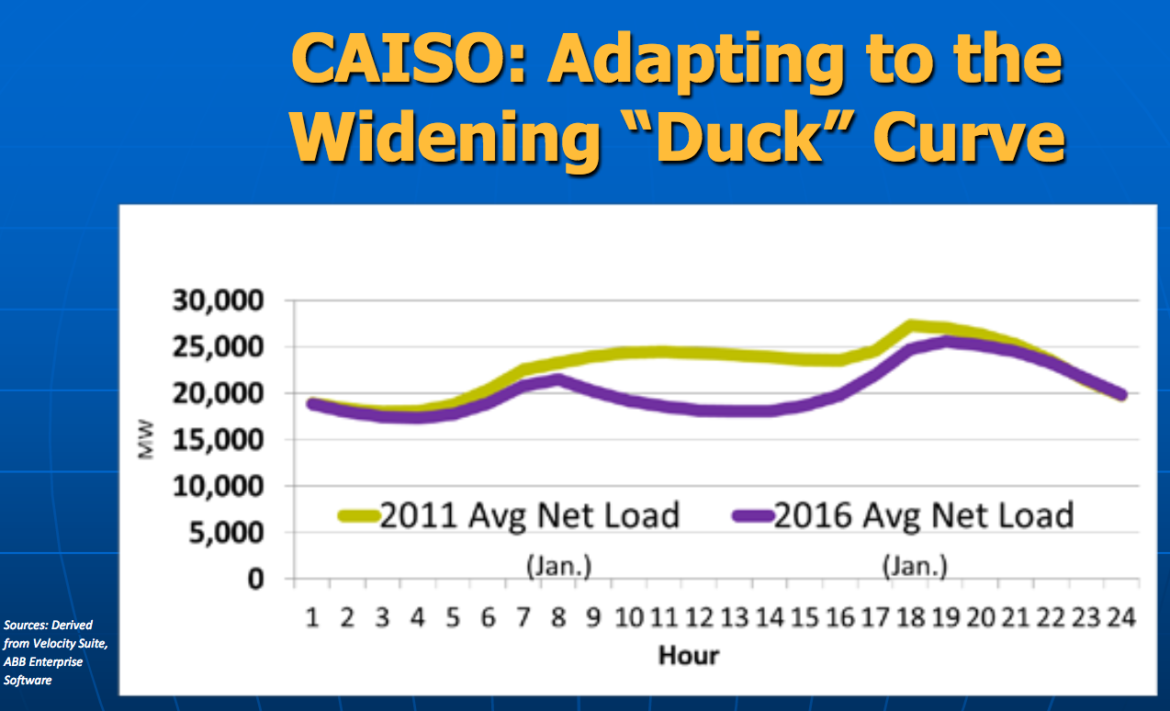
FERC
At a meeting discussing the winter outlook for utilities, FERC staff shared this image of a CAISO’s infamous “duck curve” widening as the state adds solar capacity.
Seasonal planning, like the winter preparation discussed at last week’s FERC meeting, must take into account fluctuations in renewable generation, in addition to changes in how much energy people use.
Paul Denholm, an analyst with the National Renewable Energy Laboratory, points out that, “An important element of operating the power system in the future is being able to accommodate this new interesting shape.”
States that have been adding a lot of wind generation, like Colorado, have to adapt to other new shapes – which means developing new strategies to balance power generation. For example, by running wind turbines at less than maximum capacity, grid operators can use the spare capacity as reserve power. “Wind used to be a completely uncontrollable resource,” said Denholm. But now, “wind is actually a schedulable, dispatchable resource.”
Many of the lessons learned from living with the duck in California, or living with increasing wind generation in Colorado, can translate to other parts of the country as they add more renewables to the grid.