Skip to content
  • About the Project
  • Meet the Team
  • Partners
Support Us
  • Support Us
  • Inside Energy
  • Inside Energy
  • Home
  • Podcast
  • Audio
  • Video
  • Data
  • Educators
  • IE Questions
  • IE Investigations
    • Energy According To Trump
    • Protesting The Pipeline: Standing Rock And The Dakota Access Pipeline
    • Your Natural Gas Boom Is Leaking
    • Feasting On Fuel
    • Reclamation Blues: The Lingering Legacy Of Fossil Fuels
    • Blackout: Reinventing The Grid
    • Denmark’s Road To Renewables
    • The Future Of Coal
    • The Fallout From Falling Oil Prices
    • The Oilfield Spill Problem
    • Energy And The New Congress
    • Boom 2.0
    • Dark Side Of The Boom
    • The Solar Challenge
    • The Pipeline Network
    • Coal Watch
  • Newsletter
  • Support Us
  • Get To Know Us
    • About the Project
    • Meet the Team
    • Partners

Inside Energy - Bringing energy reporting down to Earth

Inside Energy (https://insideenergy.org/2014/05/29/visualizing-wyoming-and-north-dakotas-emissions-intensive-economies/)

  • Home
  • Podcast
  • Audio
  • Video
  • Data
  • Educators
  • IE Questions
  • IE Investigations
    • Energy According To Trump
    • Protesting The Pipeline: Standing Rock And The Dakota Access Pipeline
    • Your Natural Gas Boom Is Leaking
    • Feasting On Fuel
    • Reclamation Blues: The Lingering Legacy Of Fossil Fuels
    • Blackout: Reinventing The Grid
    • Denmark’s Road To Renewables
    • The Future Of Coal
    • The Fallout From Falling Oil Prices
    • The Oilfield Spill Problem
    • Energy And The New Congress
    • Boom 2.0
    • Dark Side Of The Boom
    • The Solar Challenge
    • The Pipeline Network
    • Coal Watch
  • Newsletter
BEA

Visualizing Wyoming And North Dakota’s Emissions-Intensive Economies

By Jordan Wirfs-Brock Jordan Wirfs-Brock | May 29, 2014
More
  • More on BEA
  • Subscribe to BEA

As states ready for the Obama Administration to release new carbon emissions regulations next week, a major question looms: What’s the most sensible way to measure and compare greenhouse gas production?

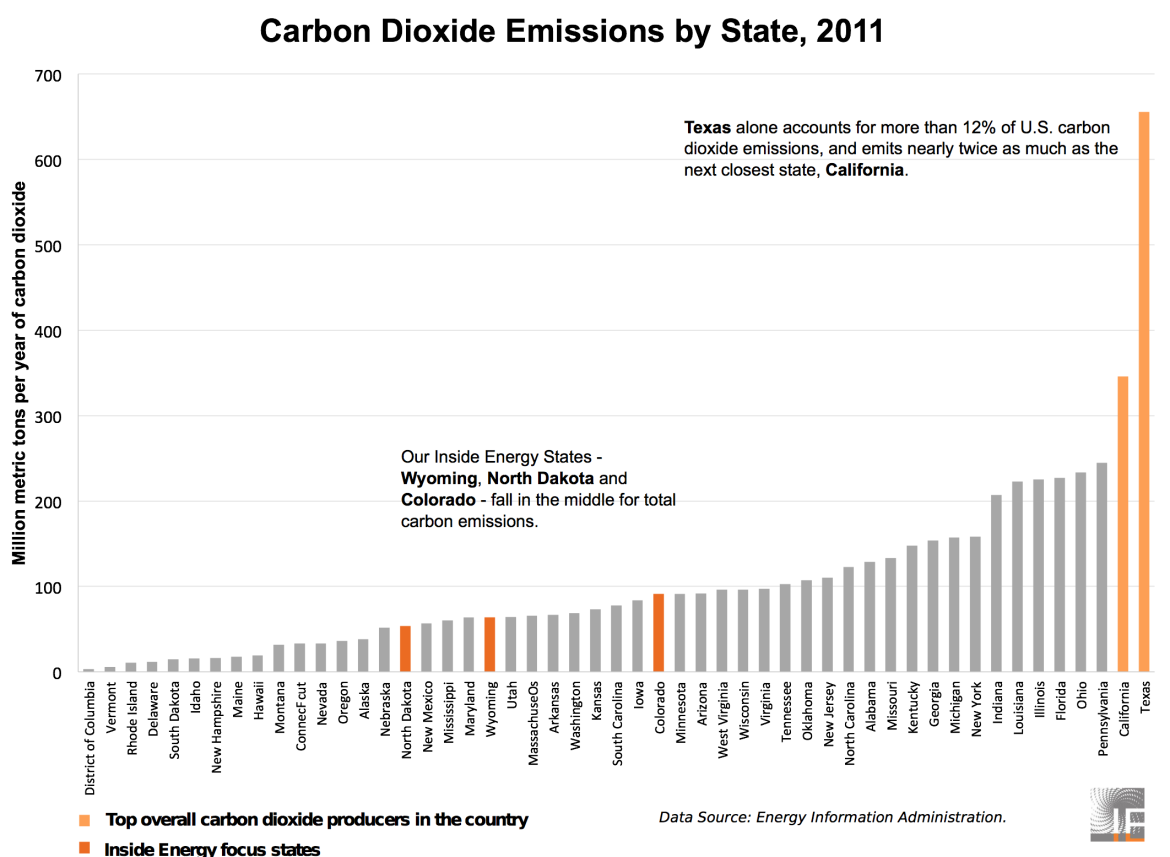
Two states dwarf all others when it comes to sheer amount of carbon dioxide released: Texas and California. Texas is such a carbon giant that it accounts for 12% of U.S. emissions and produces nearly twice as much as the next closest state, California. This graph shows 2011 carbon dioxide emissions based on Energy Information Administration (EIA) data:

Screen Shot 2014-05-29 at 1.18.49 PM

Jordan Wirfs-Brock / Inside Energy

Brock / Inside Energy

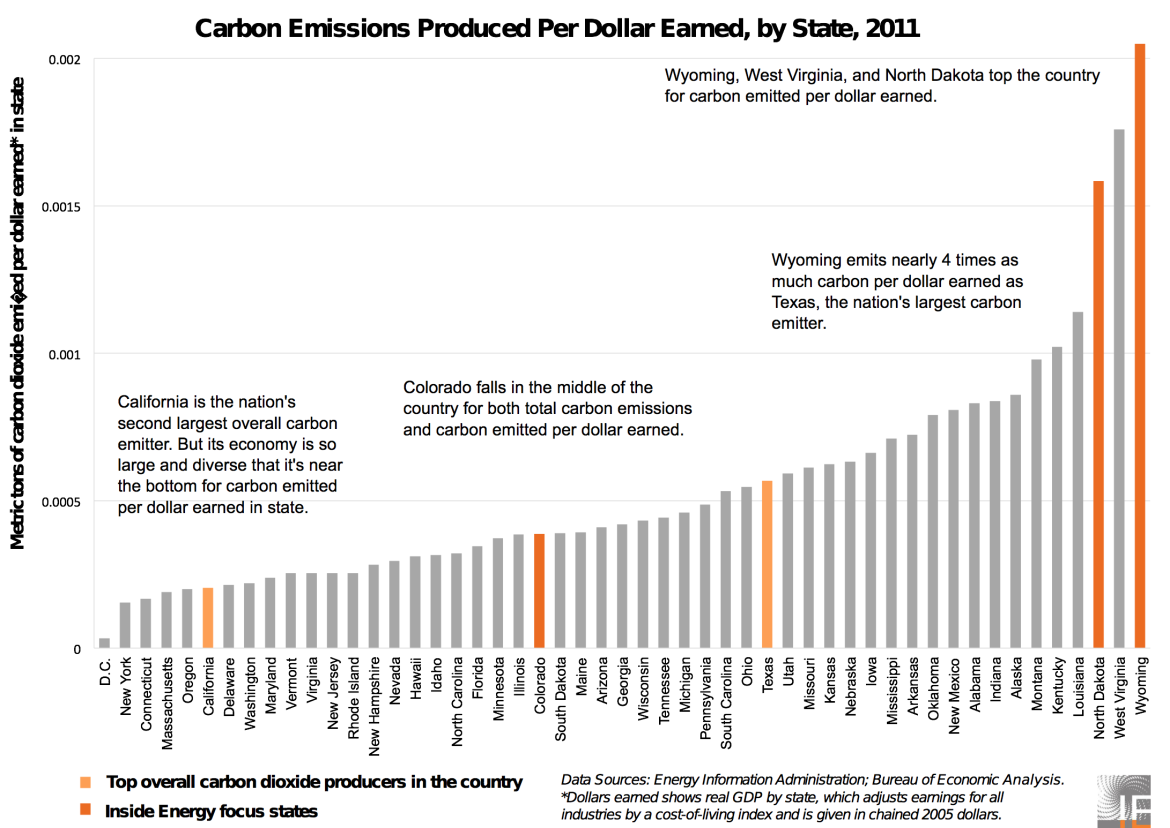
But there’s more than one way to slice and dice emissions data. Looking at carbon dioxide produced per dollar earned by industry, the story changes: Wyoming tops all states in carbon emitted per dollar earned, followed by West Virginia and North Dakota.

Here’s how all fifty states measure up on emissions per dollar, based on EIA and Bureau of Economic Analysis (BEA) data:

Screen Shot 2014-05-29 at 12.15.27 PM

Jordan Wirfs-Brock / Inside Energy

Brock / Inside Energy

Top overall emitter Texas now falls in the middle, and California is near the bottom. With diverse economies, their energy industries are balanced by other sectors. Wyoming and North Dakota, on the other hand, rely heavily on energy production to drive their carbon-intensive economies.

And how about Inside Energy focus-state Colorado?  Because Colorado’s energy and economic portfolios are diverse, it lands squarely in the middle for both total emissions and emissions per dollar.

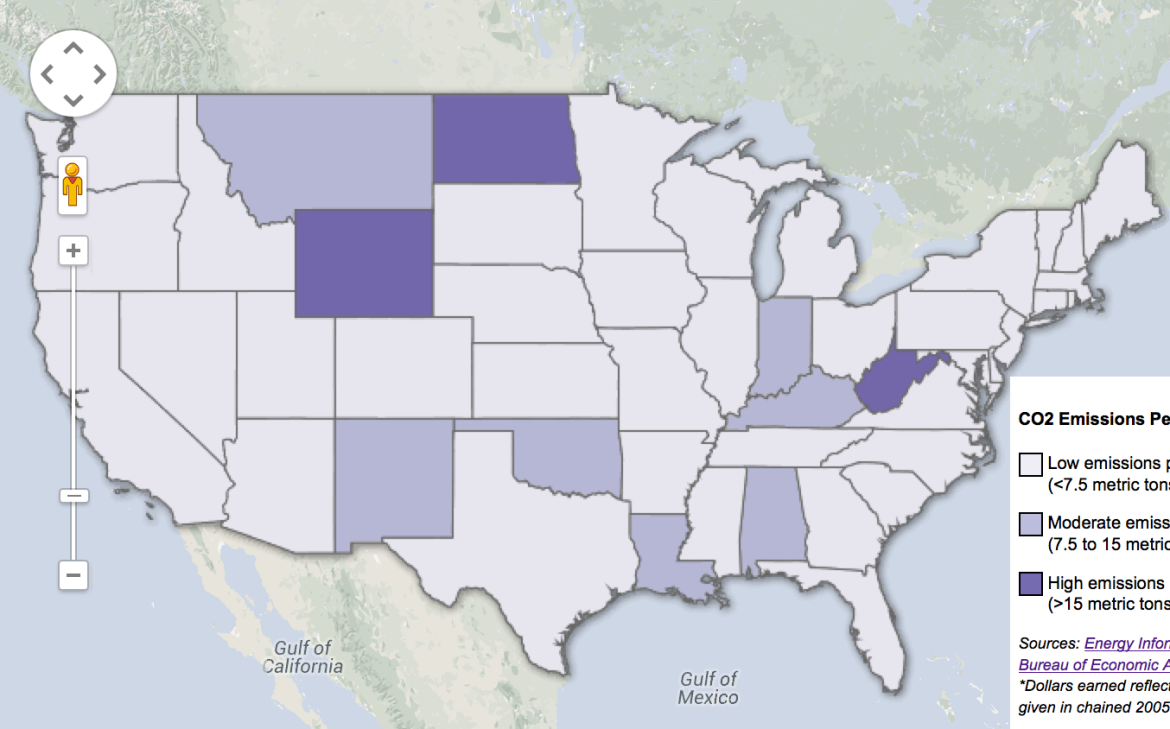
Here’s what the emissions and earnings data look like on a map:

Total Carbon Dioxide Emissions by State, 2011

Carbon Dioxide Produced Per Dollar Earned by State, 2011

The data wrangling doesn’t stop there…

  • Texas and California are major carbon producers, but they house a fifth of the country’s population. If we look at carbon emissions per person, Wyoming and North Dakota top the country, based on analysis from I-News.
  • If we look at carbon emissions per amount of energy produced – as a report from Ceres, Bank of America, several power companies, and the Natural Resources Defense Council does – Wyoming and North Dakota are still at the top.

How we measure and compare carbon matters. Next week, we’ll find out what the new emissions regulations entail. At Inside Energy, we’ll be covering what these new regulations mean for Wyoming, North Dakota and Colorado,  and whether it will be harder for states with emissions-intensive economies to keep pace.

Read More: “White House Cracks Down On Power Plant Emissions,” by Stephanie Joyce for Inside Energy and Wyoming Public Radio

Nerd Notes:

  • Carbon dioxide emissions are in million metric tons per year. The most recent year of data available is 2011, and data reflects energy-related carbon dioxide, which the EIA has deemed an appropriate proxy for overall greenhouse gas emissions. Read more about the EIA’s methodology.
  • State earnings reflect 2011 “real GDP,” published by the Bureau of Economic Analysis. Real GDP, which is in chained 2005 dollars, combines earnings of all industries within each state and adjusts for regional cost-of-living variation. The BEA also releases regular GDP data per state, which yielded similar results in the analysis.
  • On the graph of emissions per dollar earned, the unit is metric tons of carbon per chained 2005 dollar. To create the map, this was scaled by a factor of 10,000, so the unit is metric tons of carbon released per $10,000 dollars.


More
  • More on BEA
  • Subscribe to BEA

Related Series

Data

Tags
  • Inside Energy News
  • Making Energy
  • Moving Energy
  • Using Energy
  • BEA
  • Bureau of Economic Analysis
  • California
  • carbon dioxide
  • Colorado
  • data
  • data visualization
  • Economy
  • EIA
  • emissions
  • Energy Information Administration
  • GDP
  • Inside Energy Now
  • North Dakota
  • regulations
  • Texas

About Jordan Wirfs-Brock

Jordan Wirfs-Brock

Jordan Wirfs-Brock was Inside Energy's first data journalist, based in Colorado. Now she's living in the San Juan Islands, but is still helping us out. When she's not wrangling data, she enjoys running up and down mountains, doodling, playing board games and brewing beer.

  • More by Jordan

Read Next

  • A Closer Look At EPA Emissions Rules For Colorado, North Dakota, Wyoming

    Monday, the Environmental Protection Agency proposed rules to cut carbon dioxide emissions from the nation’s fossil fuel-fired power plants. What do those rules mean for Inside Energy focus states Colorado, North Dakota and Wyoming? State goals
    Based on each state’s energy portfolio and economy, the EPA assigned state-specific emissions goals for the year 2030.

Previous Post
FULL INTERVIEW: Colorado Gov. Hickenlooper On Debate Over Local Control Of Fracking
Next Post
White House to Crack Down On Power Plant Emissions
Inside Energy is a collaborative journalism initiative of partners across the US and supported by the Corporation for Public Broadcasting
  • Inside Energy
  • About The Project
  • Meet The Team
  • Newsletter
  • Contact Us
  • Terms Of Use

Search This Site

Browse Archives

© Copyright 2023, Inside Energy

Inside Energy is a member of the Institute for Nonprofit News

Built with the Largo WordPress Theme from the Institute for Nonprofit News.

Back to top ↑